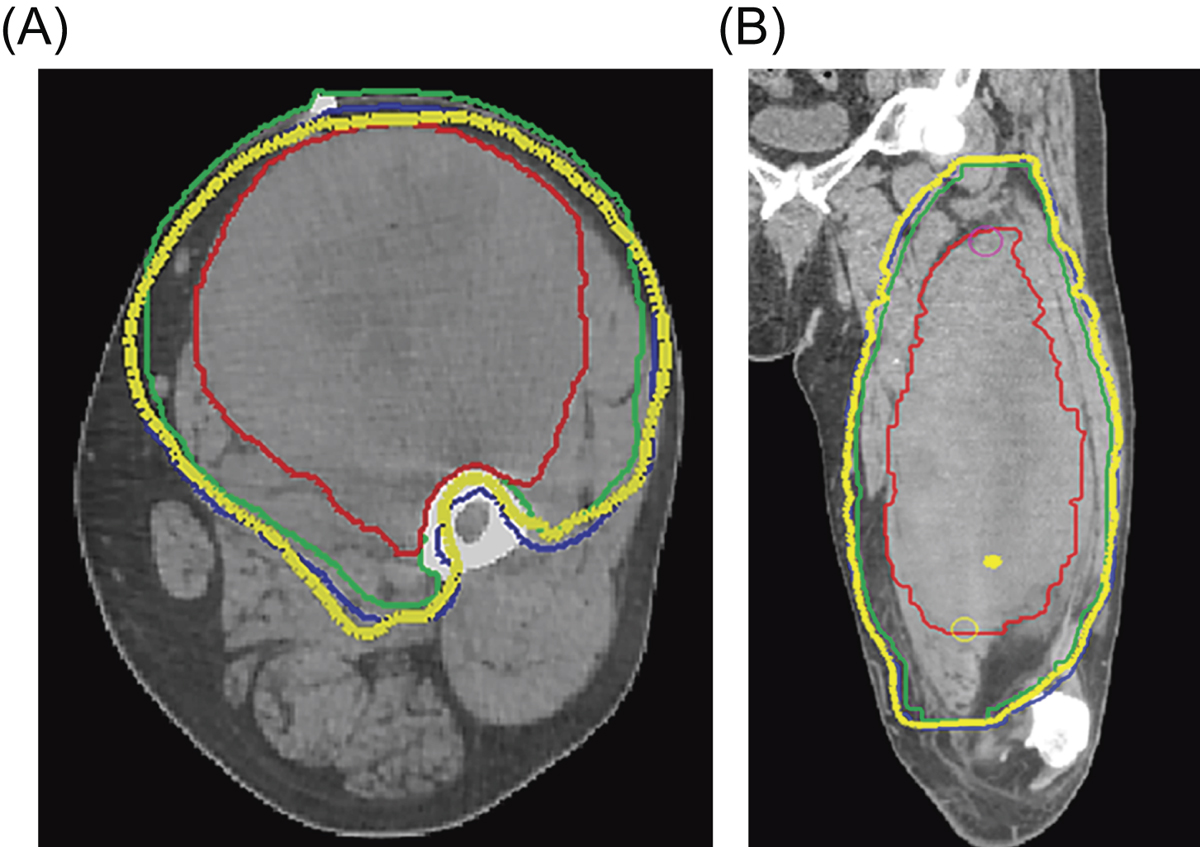
Figure 2.
Download original image
Preoperative radiotherapy planning volumes for the patient in Figure 1 are shown on axial (A) and coronal (B) CT images. The Gross Tumor Volume (GTV) is demonstrated by the solid red contour; Clinical Target Volume (CTV) is demonstrated by the green solid contour; Planning Target Volume (PTV) is shown by the blue solid contour; and the thick yellow line represents the prescribed radiotherapy dose volume. Note that intensity-modulated radiotherapy (IMRT) was used to adequately encompass the radiotherapy target volume while avoiding the bone by sculpting the high dose volume around the femoral cortex for protection purposes (A), while also accounting for the peritumoral edema surrounding the lesion (B) which was demonstrated on the coronal fat-saturated T2 post-gadolinium image in Figures 1C and 1D.
Current usage metrics show cumulative count of Article Views (full-text article views including HTML views, PDF and ePub downloads, according to the available data) and Abstracts Views on Vision4Press platform.
Data correspond to usage on the plateform after 2015. The current usage metrics is available 48-96 hours after online publication and is updated daily on week days.
Initial download of the metrics may take a while.