Figure 5
Download original image
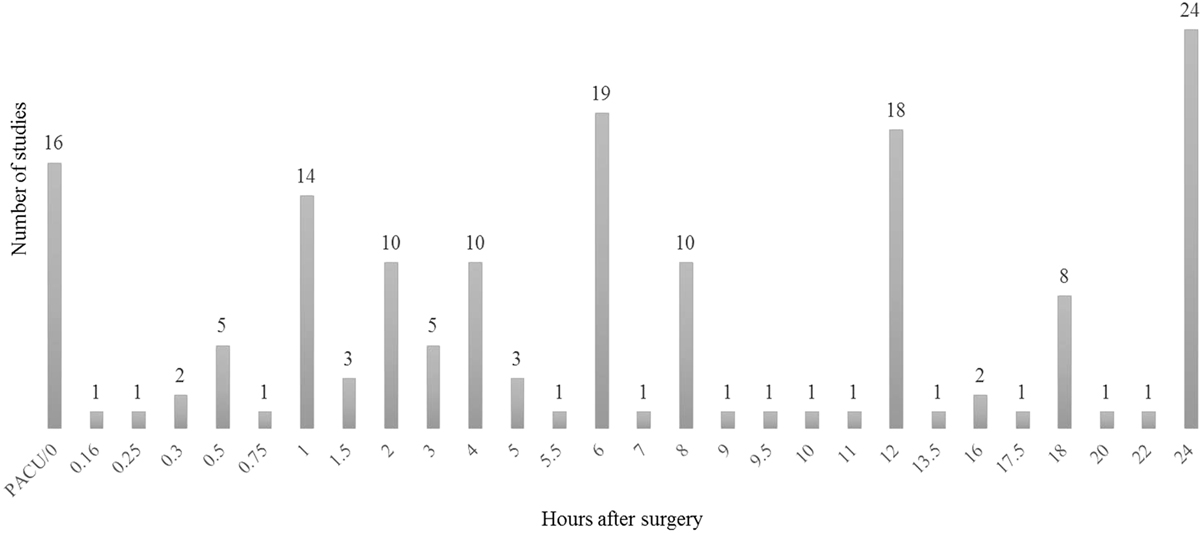
Number of studies using a specific time point, first 24-hour postoperative pain recordings. Data from 32 studies are included with a total of 162 measurements, equaling a mean of 5.1 pain recordings per study on POD1. *Erden et al. measured pain within time intervals 0–3, 4–7, 8–11, 12–15, 16–19, 20–24 hours. To include the data, the middle range was chosen as time of measurement. **Jo et al. recorded pain 5 hours postoperatively and then three times daily (at 0:00 am, 9:00 am, and 5:00 pm). Since we do not know what time of day the patients were operated, only the first recording after 5 hours is included in the graph. ***Ryu et al. measured pain hourly until request of rescue analgesic which was requested at a mean of 11 hours and 45 minutes postoperatively on which basis we added these 11 pain recordings to the graph.
Current usage metrics show cumulative count of Article Views (full-text article views including HTML views, PDF and ePub downloads, according to the available data) and Abstracts Views on Vision4Press platform.
Data correspond to usage on the plateform after 2015. The current usage metrics is available 48-96 hours after online publication and is updated daily on week days.
Initial download of the metrics may take a while.