Open Access
Figure 2
Download original image
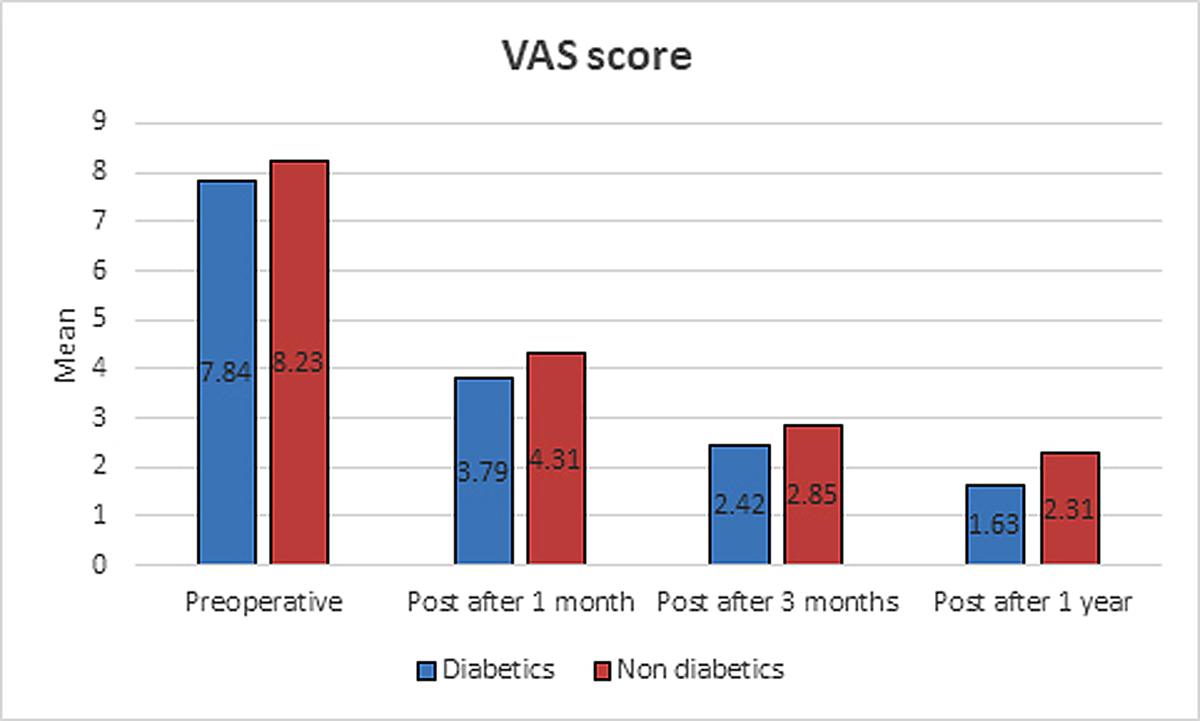
An illustrative diagram showing post-operative improvement of VAS in diabetic and non-diabetic patients after RI release (at 1, 3 and 12 months follow-up). No difference was found in VAS between both groups.
Current usage metrics show cumulative count of Article Views (full-text article views including HTML views, PDF and ePub downloads, according to the available data) and Abstracts Views on Vision4Press platform.
Data correspond to usage on the plateform after 2015. The current usage metrics is available 48-96 hours after online publication and is updated daily on week days.
Initial download of the metrics may take a while.