Figure 3
Download original image
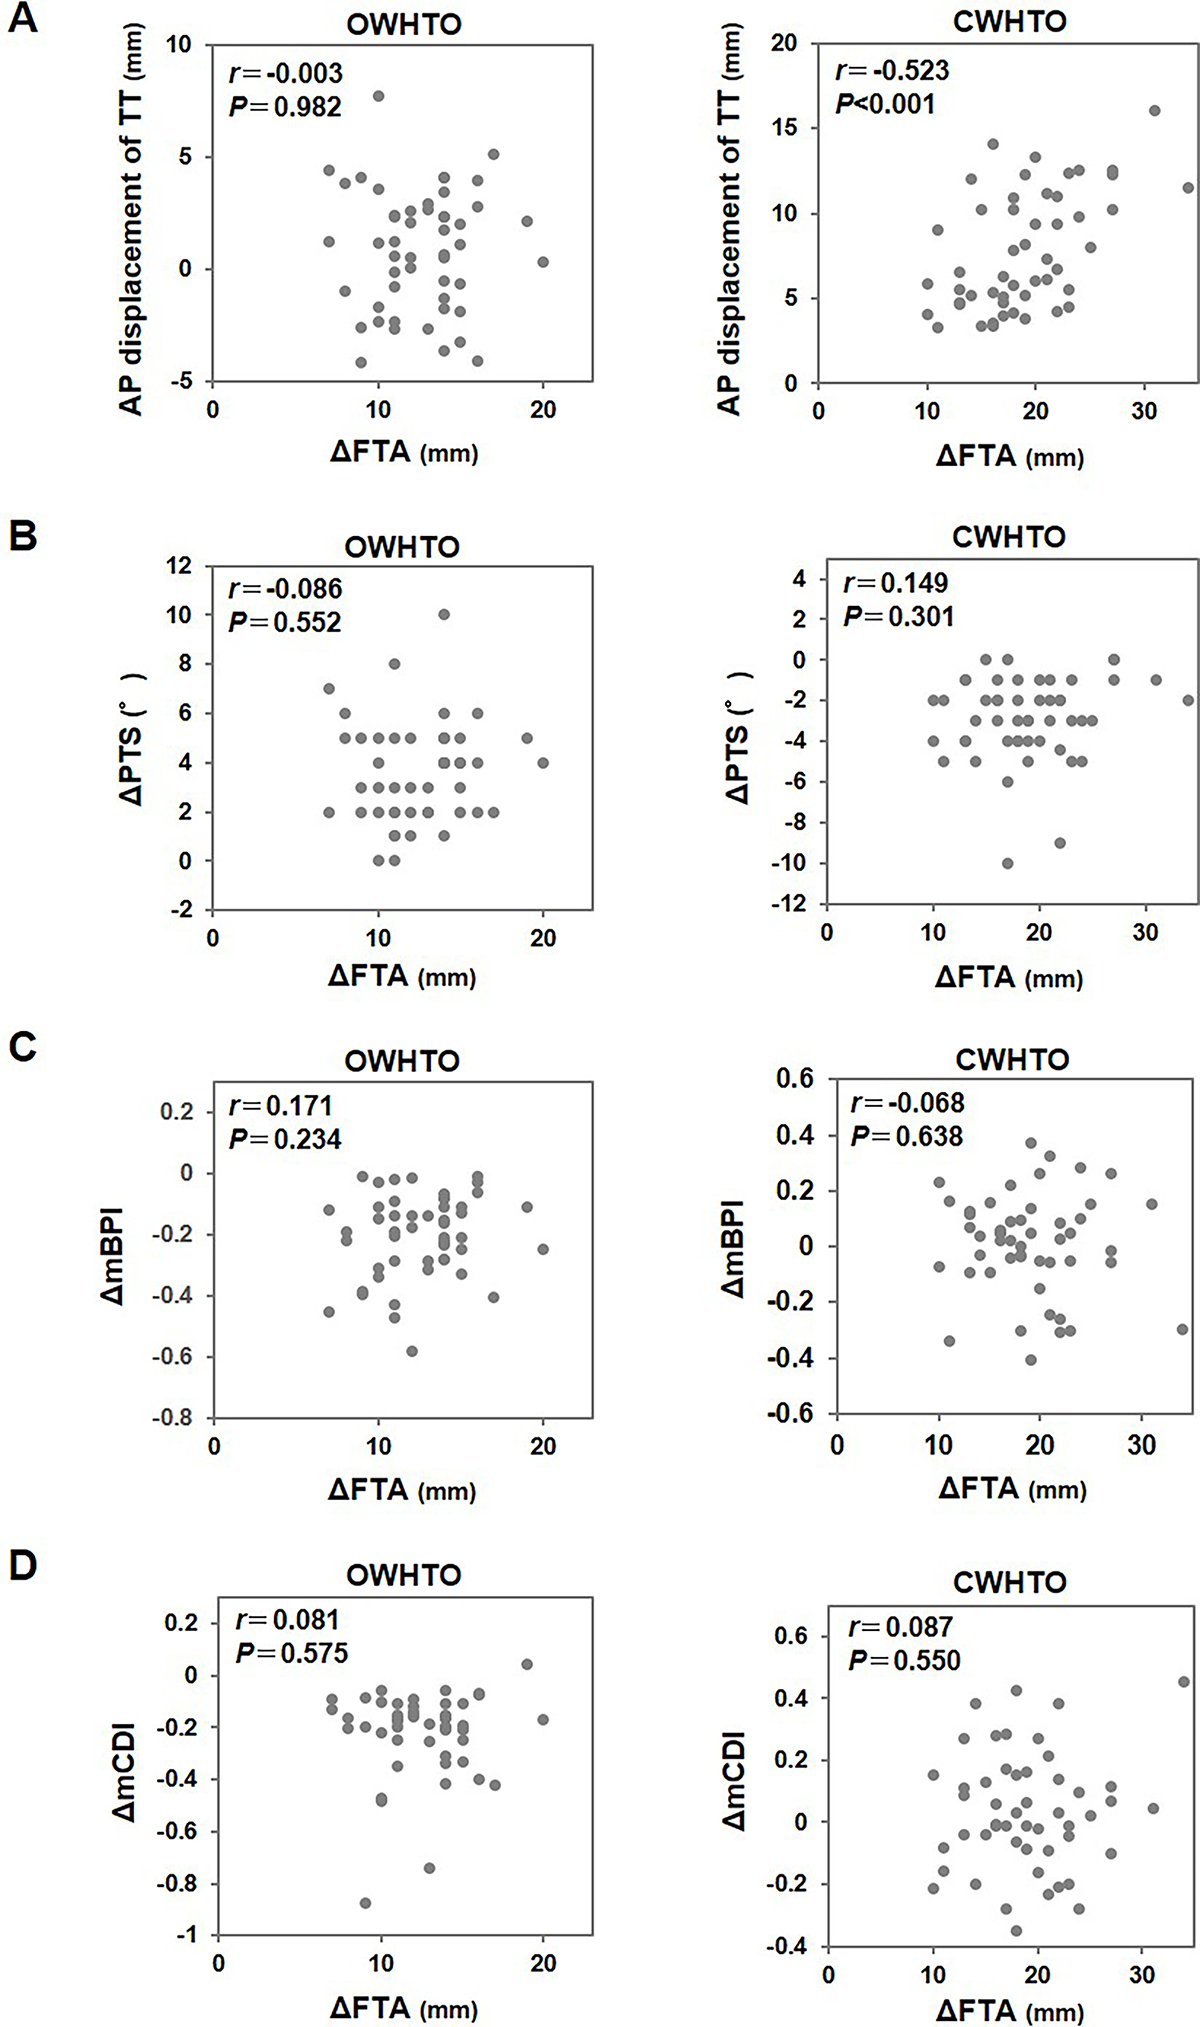
Scatter plots showing the relationships between the correction angle (∆FTA) and radiographic parameters. (A) anterior-posterior displacement of the tibial tuberosity, (B) change of posterior tibial slope (∆PTS), (C) change of the modified Blackburne-Peel index (∆mBPI), and (D) change of the modified Caton-Deschamps index (∆mCDI) in OWHTO (left panels) and CWHTO (right panels).
Current usage metrics show cumulative count of Article Views (full-text article views including HTML views, PDF and ePub downloads, according to the available data) and Abstracts Views on Vision4Press platform.
Data correspond to usage on the plateform after 2015. The current usage metrics is available 48-96 hours after online publication and is updated daily on week days.
Initial download of the metrics may take a while.