Open Access
Figure 4
Download original image
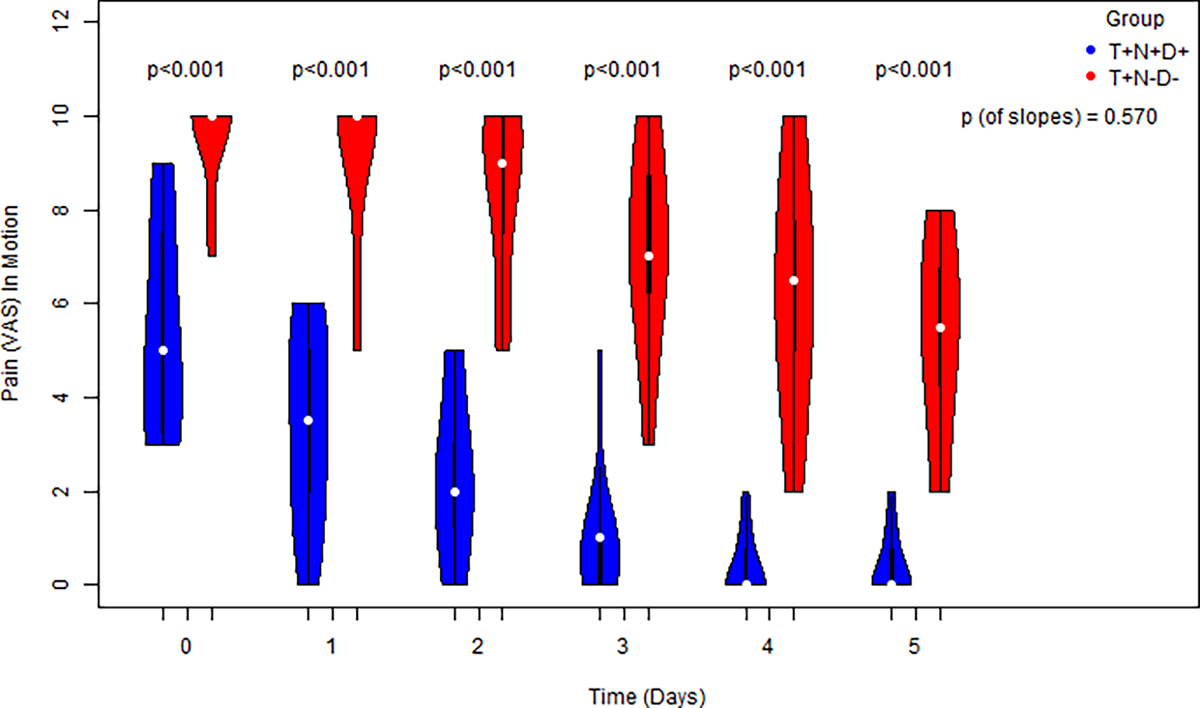
The progress of postoperative pain scores in motion of cases vs. controls for 0–5 days in sequence and a comparison for each distinct time point via the usage of side-by-side violin plots. Comparison of the equivalent slopes indicating a decrease in both groups.
Current usage metrics show cumulative count of Article Views (full-text article views including HTML views, PDF and ePub downloads, according to the available data) and Abstracts Views on Vision4Press platform.
Data correspond to usage on the plateform after 2015. The current usage metrics is available 48-96 hours after online publication and is updated daily on week days.
Initial download of the metrics may take a while.