Figure 4
Download original image
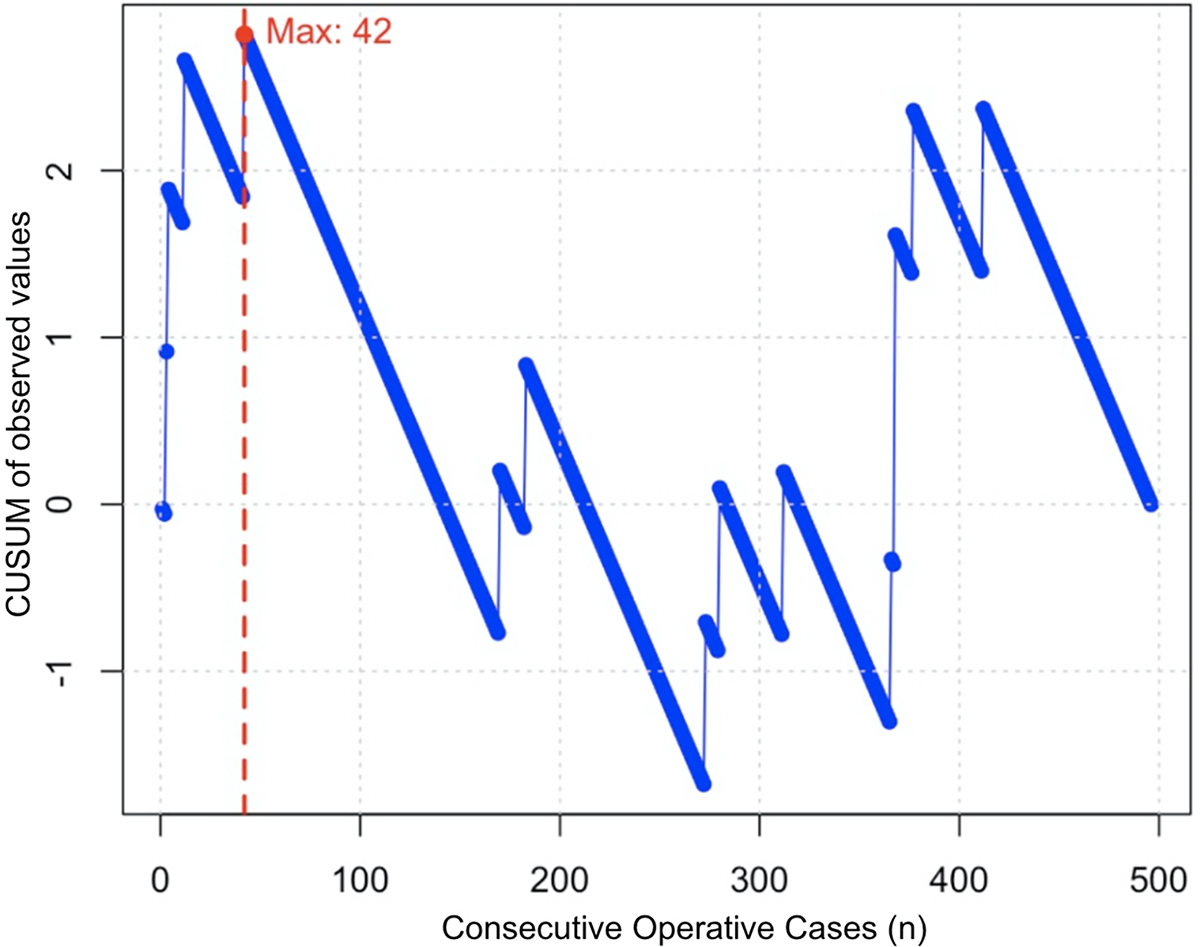
CUSUM analysis of postoperative complications. Each point represents a binary outcome (presence or absence of complication), with deviations from a predefined reference value (6%) cumulatively summed. The initial rising curve up to case 42 reflects a higher-than-expected complication rate during the learning phase. The inflection point at case 42 (red dot and dashed line) marks the transition to improved surgical performance. After this point, the consistent downward trend indicates reduced complication rates.
Current usage metrics show cumulative count of Article Views (full-text article views including HTML views, PDF and ePub downloads, according to the available data) and Abstracts Views on Vision4Press platform.
Data correspond to usage on the plateform after 2015. The current usage metrics is available 48-96 hours after online publication and is updated daily on week days.
Initial download of the metrics may take a while.