Figure 1.
Download original image
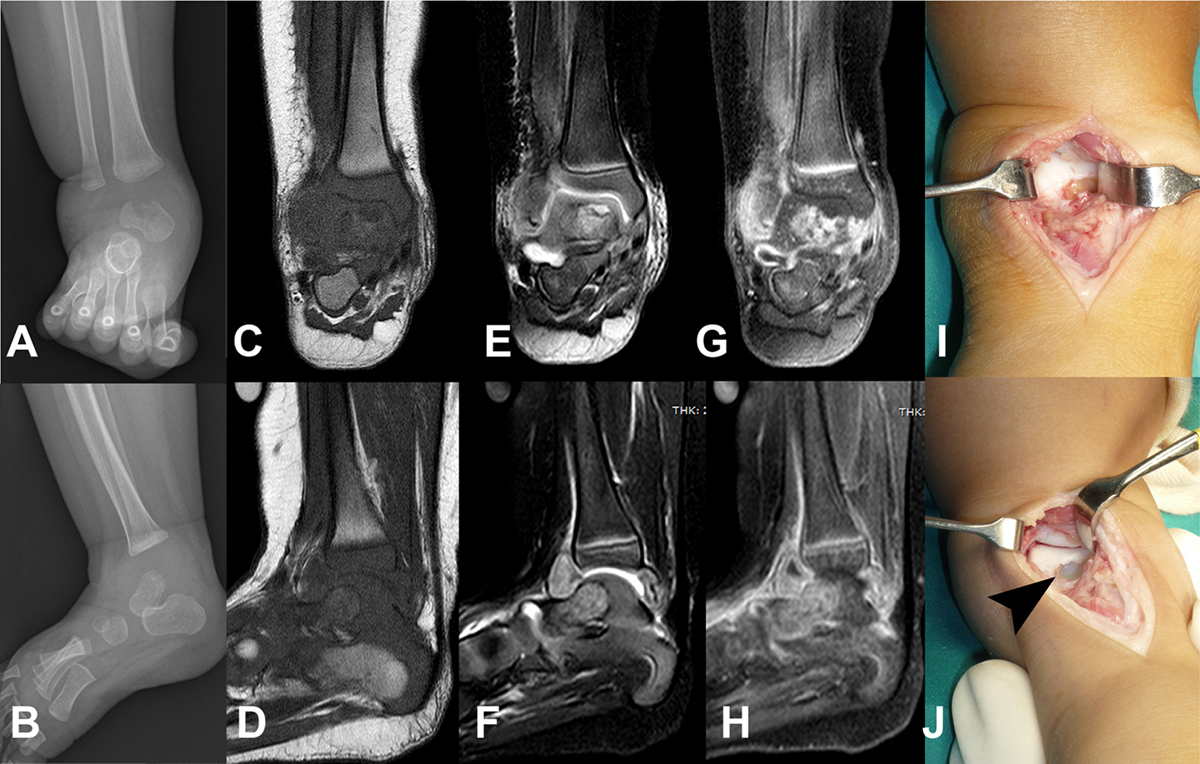
Anteroposterior (A) and lateral (B) radiographs of the right ankle of patient 1 are shown along with magnetic resonance imaging images in T1 weighted (C, D), T2 weighted (E, F), and gadolinium-enhanced (G, H). Intraoperative finding before (I) and after (J) debridement is demonstrated. The arrowhead represents an osteolytic lesion at the talus.
Current usage metrics show cumulative count of Article Views (full-text article views including HTML views, PDF and ePub downloads, according to the available data) and Abstracts Views on Vision4Press platform.
Data correspond to usage on the plateform after 2015. The current usage metrics is available 48-96 hours after online publication and is updated daily on week days.
Initial download of the metrics may take a while.