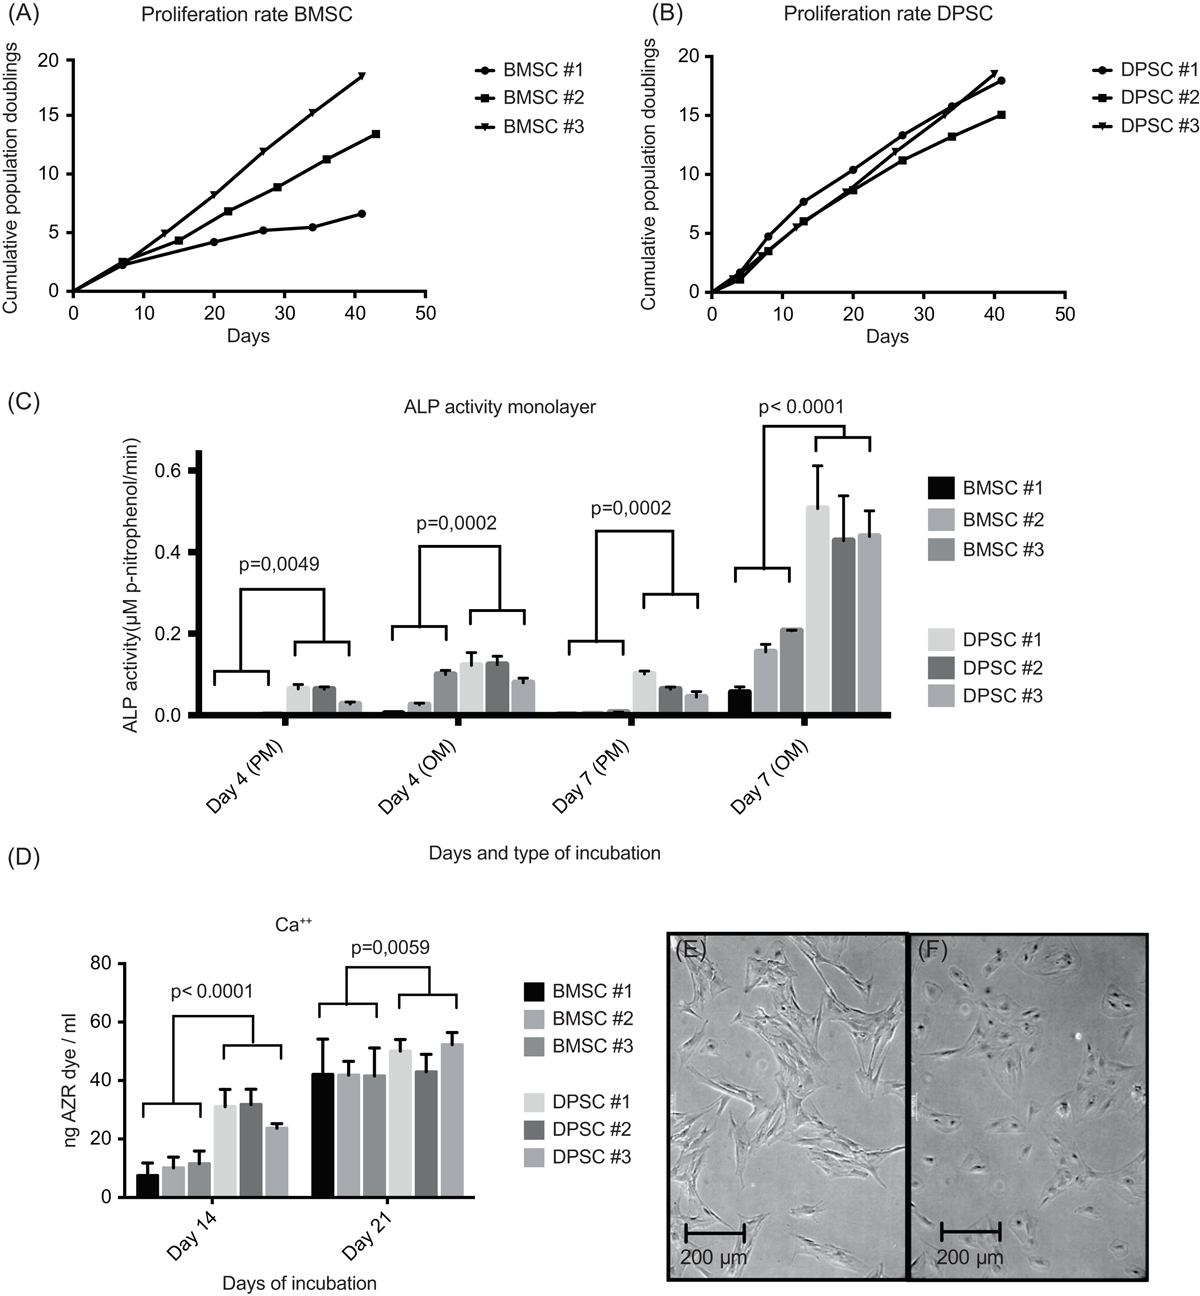
Figure 2.
Download original image
In vitro monolayer culture study of BMSCs and DPSCs. The accumulated population doublings of BMSC #1-3 (a) and DPSC #1-3 (b) are depicted as points on graph with connecting lines. The graphs illustrate the diversion in PD rate in between the three BMSCs compared with the uniform PD curves of the DPSCs. The ALP activity (c) and concentration of Ca++ (d) analyses are presented as mean histograms of each individual cell line with error bars representing the technical standard deviations. P-values are based on a combined group mean for each cell type. Microscope images of BMSCs (e) and DPSCs (f) are represented from day one in the monolayer experiment setup. The morphological difference between the two cell lines is illustrated.
Current usage metrics show cumulative count of Article Views (full-text article views including HTML views, PDF and ePub downloads, according to the available data) and Abstracts Views on Vision4Press platform.
Data correspond to usage on the plateform after 2015. The current usage metrics is available 48-96 hours after online publication and is updated daily on week days.
Initial download of the metrics may take a while.