Figure 3.
Download original image
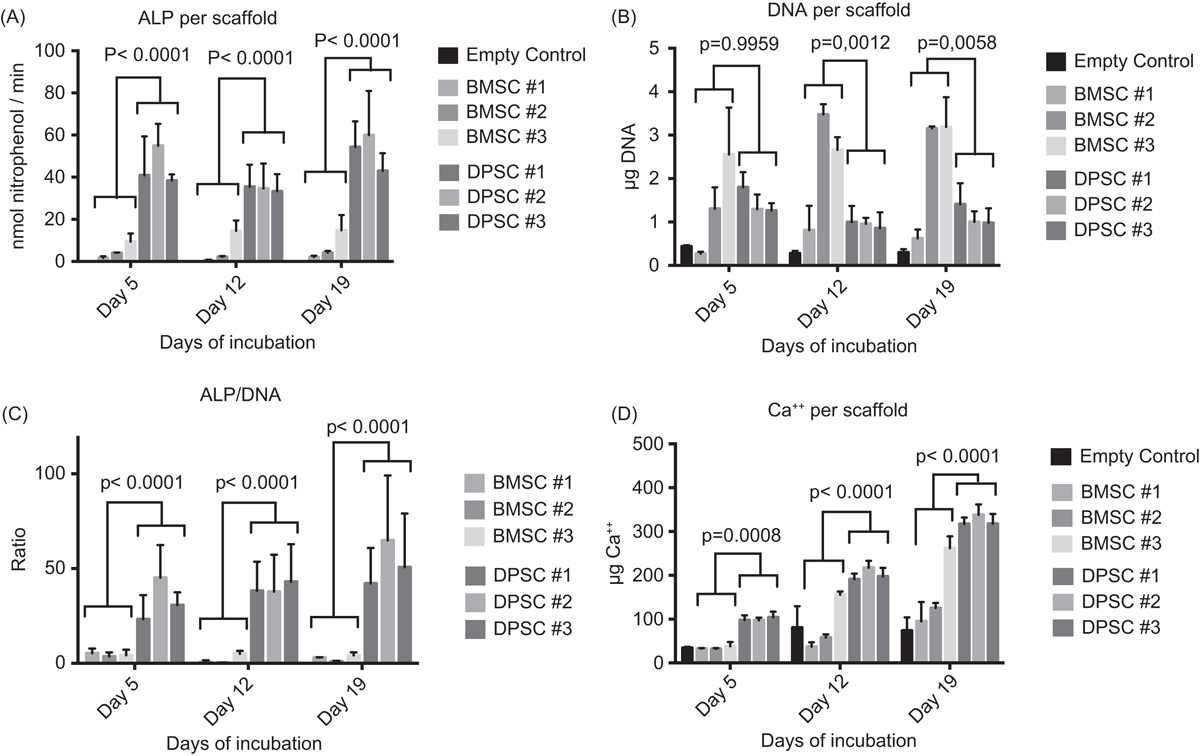
In vitro HT-PCL scaffold seeded with BMSCs or DPSCs. The group mean of the ALP, DNA, and Ca++ assays as well as ALP/DNA ratio are presented as mean histograms. Error bars represent technical standard deviations and p-values were calculated on combined cell type means. ALP, DNA, and Ca++ assays were supplemented with a negative empty HT-PCL scaffold control (n = 4) at all time points.
Current usage metrics show cumulative count of Article Views (full-text article views including HTML views, PDF and ePub downloads, according to the available data) and Abstracts Views on Vision4Press platform.
Data correspond to usage on the plateform after 2015. The current usage metrics is available 48-96 hours after online publication and is updated daily on week days.
Initial download of the metrics may take a while.