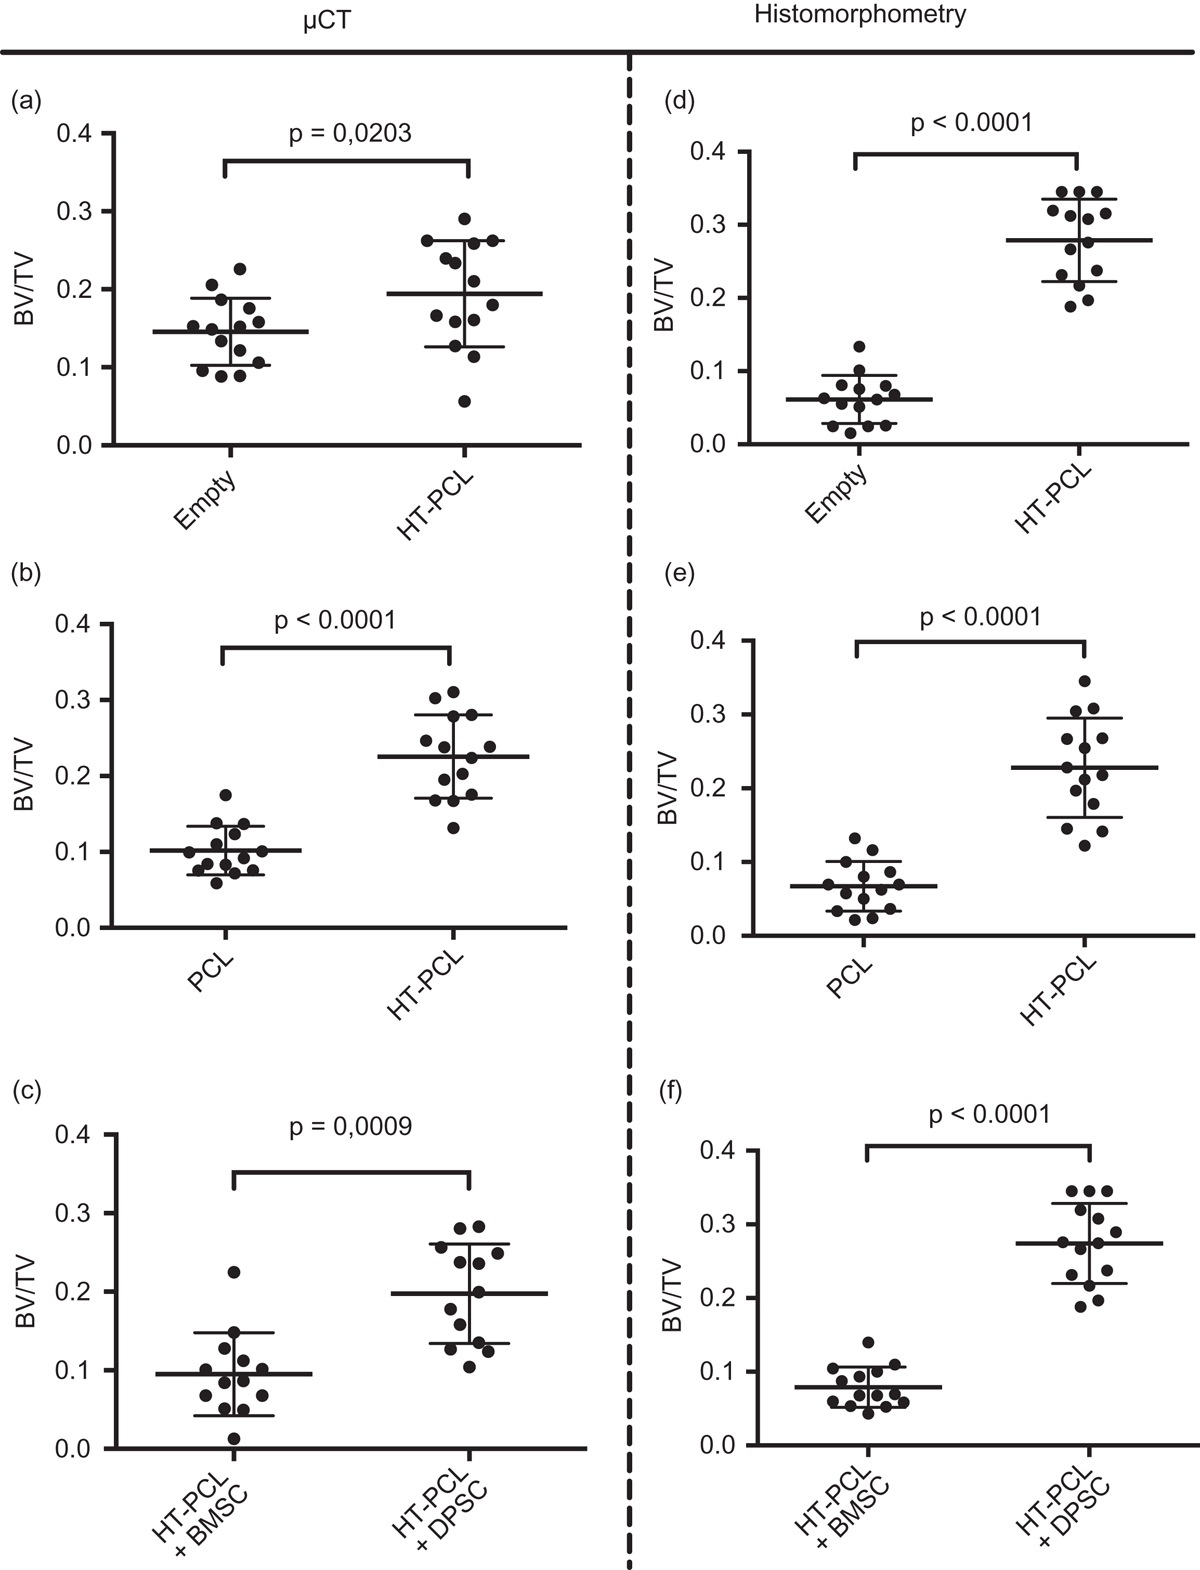
Figure 4.
Download original image
In vivo BV/TV results estimated with μCT and histomorphometry are presented as scatter plots. Individual data points are depicted with dots and middle bar represents the mean. Top and bottom bar represents standard deviations. The top two scatter plots (a and d) represent the paired sub-study with an empty defect and a HT-PCL scaffold. Middle two scatter plots (b and e) illustrate the PCL vs. HT-PCL sub-study, whereas bottom scatter plots (c and f) represent autologous BMSCs on HT-PCL scaffolds vs. autologous DPSCs on HT-PCL scaffolds.
Current usage metrics show cumulative count of Article Views (full-text article views including HTML views, PDF and ePub downloads, according to the available data) and Abstracts Views on Vision4Press platform.
Data correspond to usage on the plateform after 2015. The current usage metrics is available 48-96 hours after online publication and is updated daily on week days.
Initial download of the metrics may take a while.