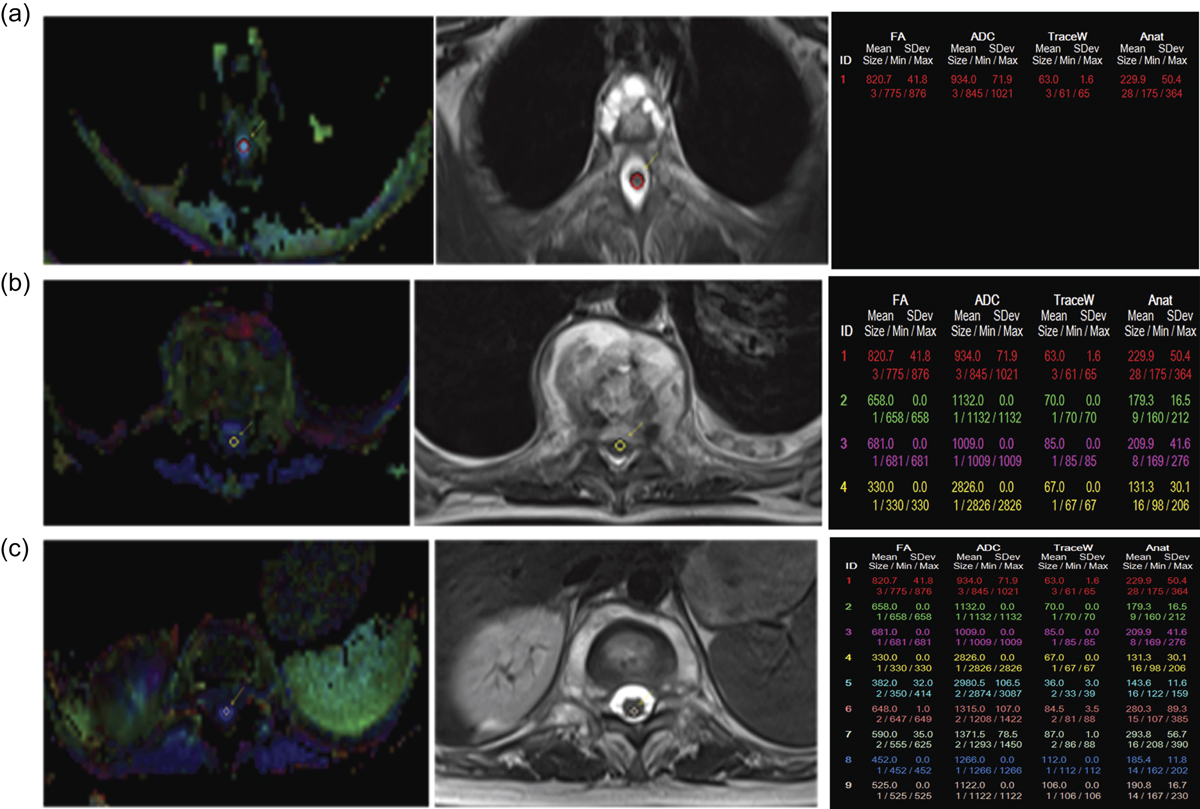
Figure 2.
Download original image
(a) Left: circular ROI drawn for calculation of FA and MD/ADC values on diffusion FA map above the site of lesion (SOL). Middle: corresponding T2 axial MRI image shows no disease above the SOL. Right: once circular ROIs were drawn, FA and MD values were generated which were recorded. Three such ROIs were drawn above the SOL. (b) Left: circular ROI drawn at the SOL. Middle: corresponding axial MRI image shows disease and compression on cord. Right: FA and MD values generated in the same color as ROI. Note: The first three values are for above the SOL. (c) Left: circular ROI drawn below the SOL. Middle: the corresponding axial MRI image shows no disease. Right: FA and MD values generated. Values (1–3) – above SOL (4–6) – at SOL (7–9) – below SOL.
Current usage metrics show cumulative count of Article Views (full-text article views including HTML views, PDF and ePub downloads, according to the available data) and Abstracts Views on Vision4Press platform.
Data correspond to usage on the plateform after 2015. The current usage metrics is available 48-96 hours after online publication and is updated daily on week days.
Initial download of the metrics may take a while.