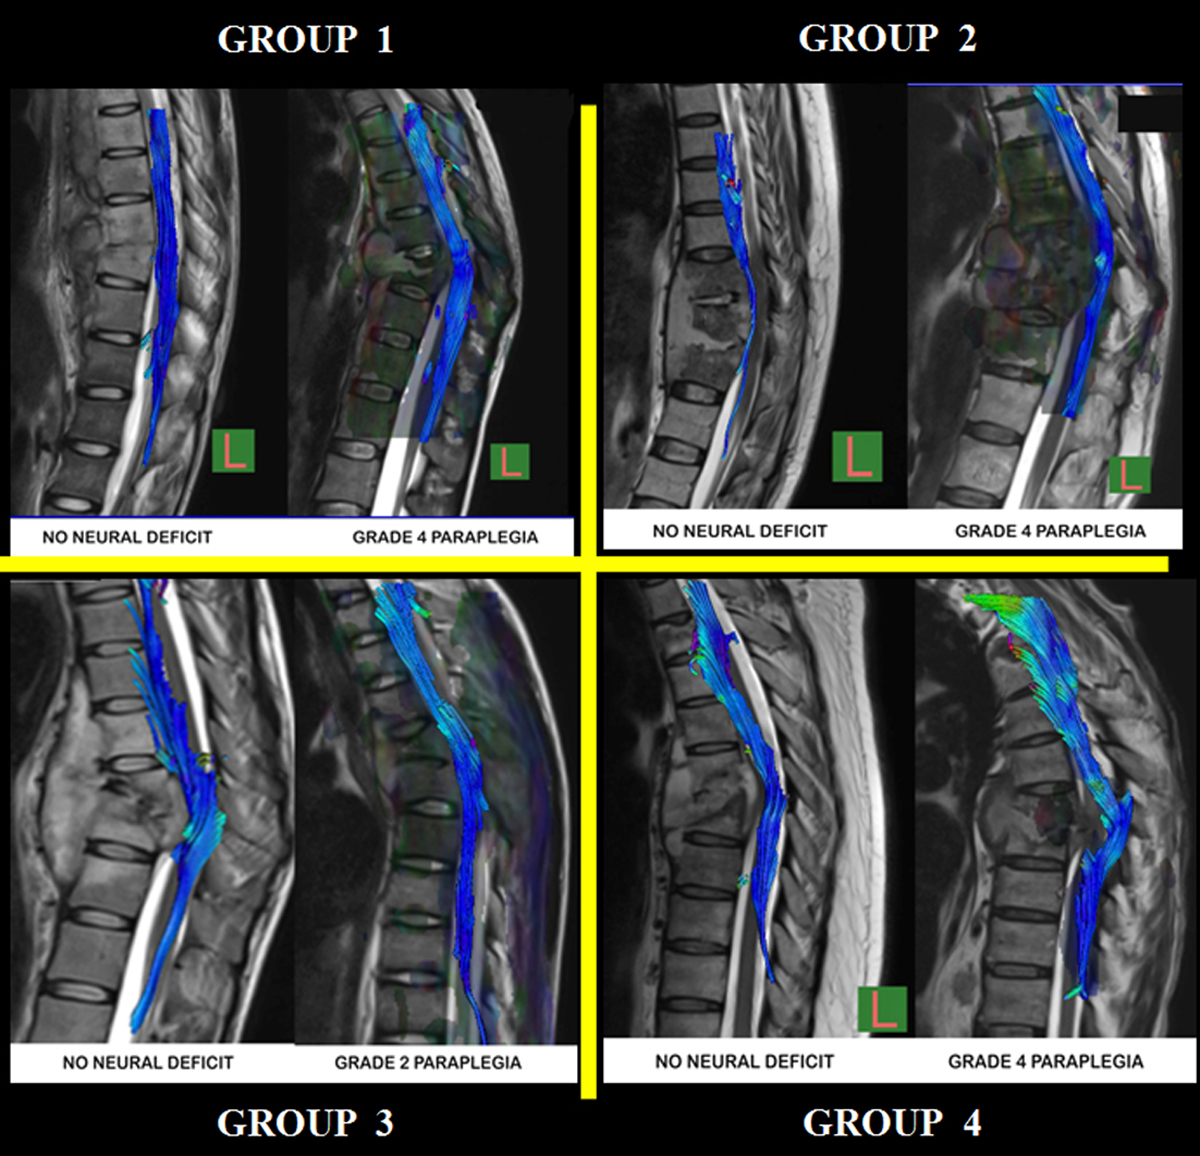
Figure 4.
Download original image
Three-dimensional tractography image acquired in the medio-lateral plane superimposed on sagittal T2WI images shown for each group. Subjective assessment of tract volume at and below site of lesion (SOL) as compared to above SOL shows that in each group, similar images are seen among patients without and with neural deficit.
Current usage metrics show cumulative count of Article Views (full-text article views including HTML views, PDF and ePub downloads, according to the available data) and Abstracts Views on Vision4Press platform.
Data correspond to usage on the plateform after 2015. The current usage metrics is available 48-96 hours after online publication and is updated daily on week days.
Initial download of the metrics may take a while.