Figure 5.
Download original image
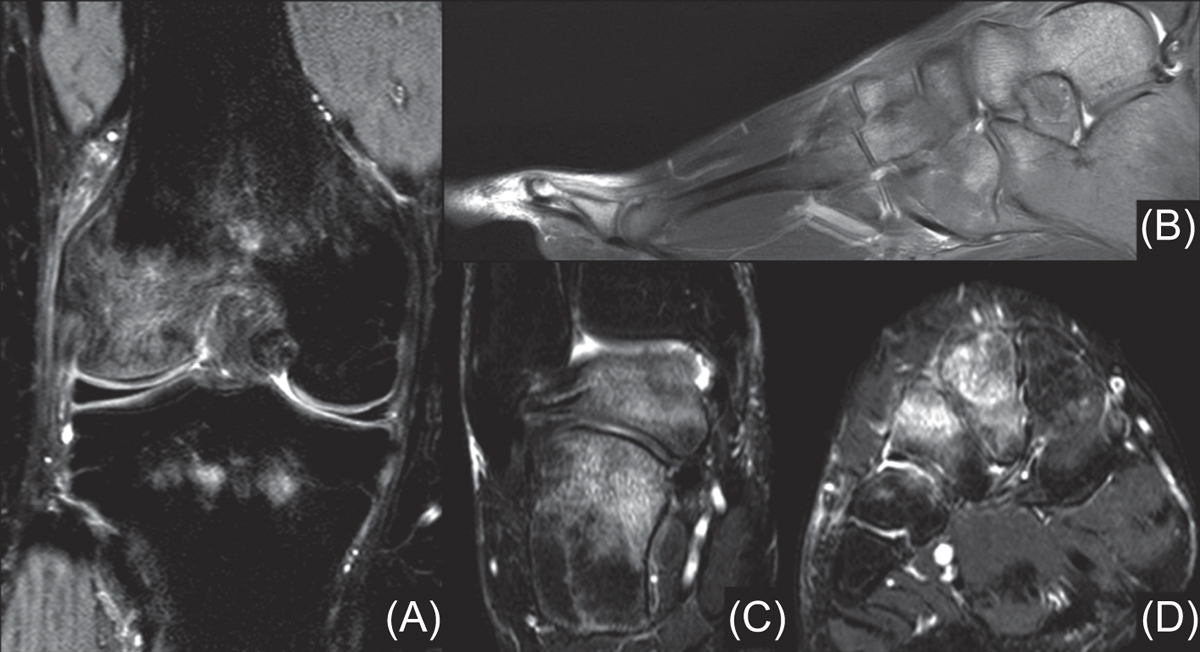
(A) T2 fat suppressed-coronal image of the right knee of the patient cited before (Figures 3 and 4) revealing diffuse intraosseous oedema, especially in the lateral femoral condyle. (B) T2 sagittal image of the patient’s right foot showing disperse bone marrow oedema of both hindfoot bones, tarsal bones and proximal phalanxes. T2 fat suppressed-coronal images of the patient’s (C) right hindfoot and (D) midfoot, with marked oedema inside the talus, calcaneus and 2nd and 3rd cuneiform bones.
Current usage metrics show cumulative count of Article Views (full-text article views including HTML views, PDF and ePub downloads, according to the available data) and Abstracts Views on Vision4Press platform.
Data correspond to usage on the plateform after 2015. The current usage metrics is available 48-96 hours after online publication and is updated daily on week days.
Initial download of the metrics may take a while.