Open Access
Figure 4
Download original image
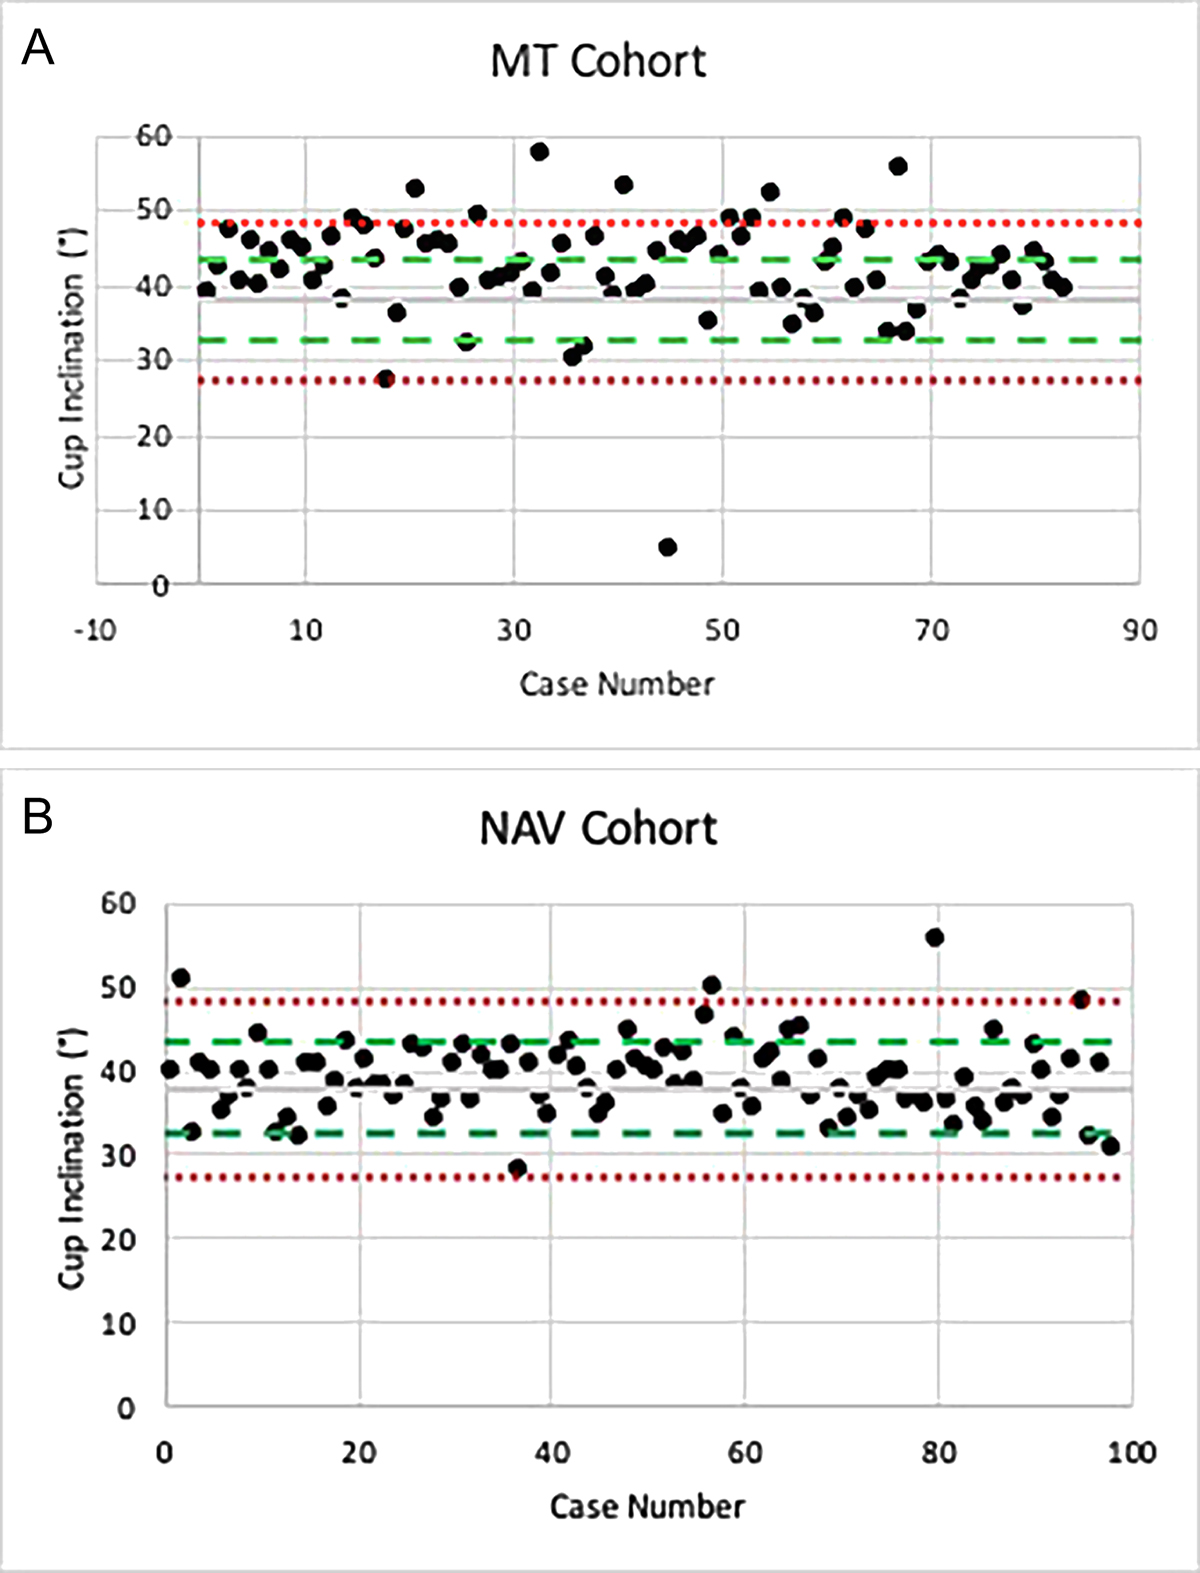
Cup inclination in degrees per case. (A) and (B) represent the MT and NAV cohorts, respectively. Grey line represents the target (38°). The dotted red line is within 10° of target and the dotted green lines represent within 5°.
Current usage metrics show cumulative count of Article Views (full-text article views including HTML views, PDF and ePub downloads, according to the available data) and Abstracts Views on Vision4Press platform.
Data correspond to usage on the plateform after 2015. The current usage metrics is available 48-96 hours after online publication and is updated daily on week days.
Initial download of the metrics may take a while.