Figure 3
Download original image
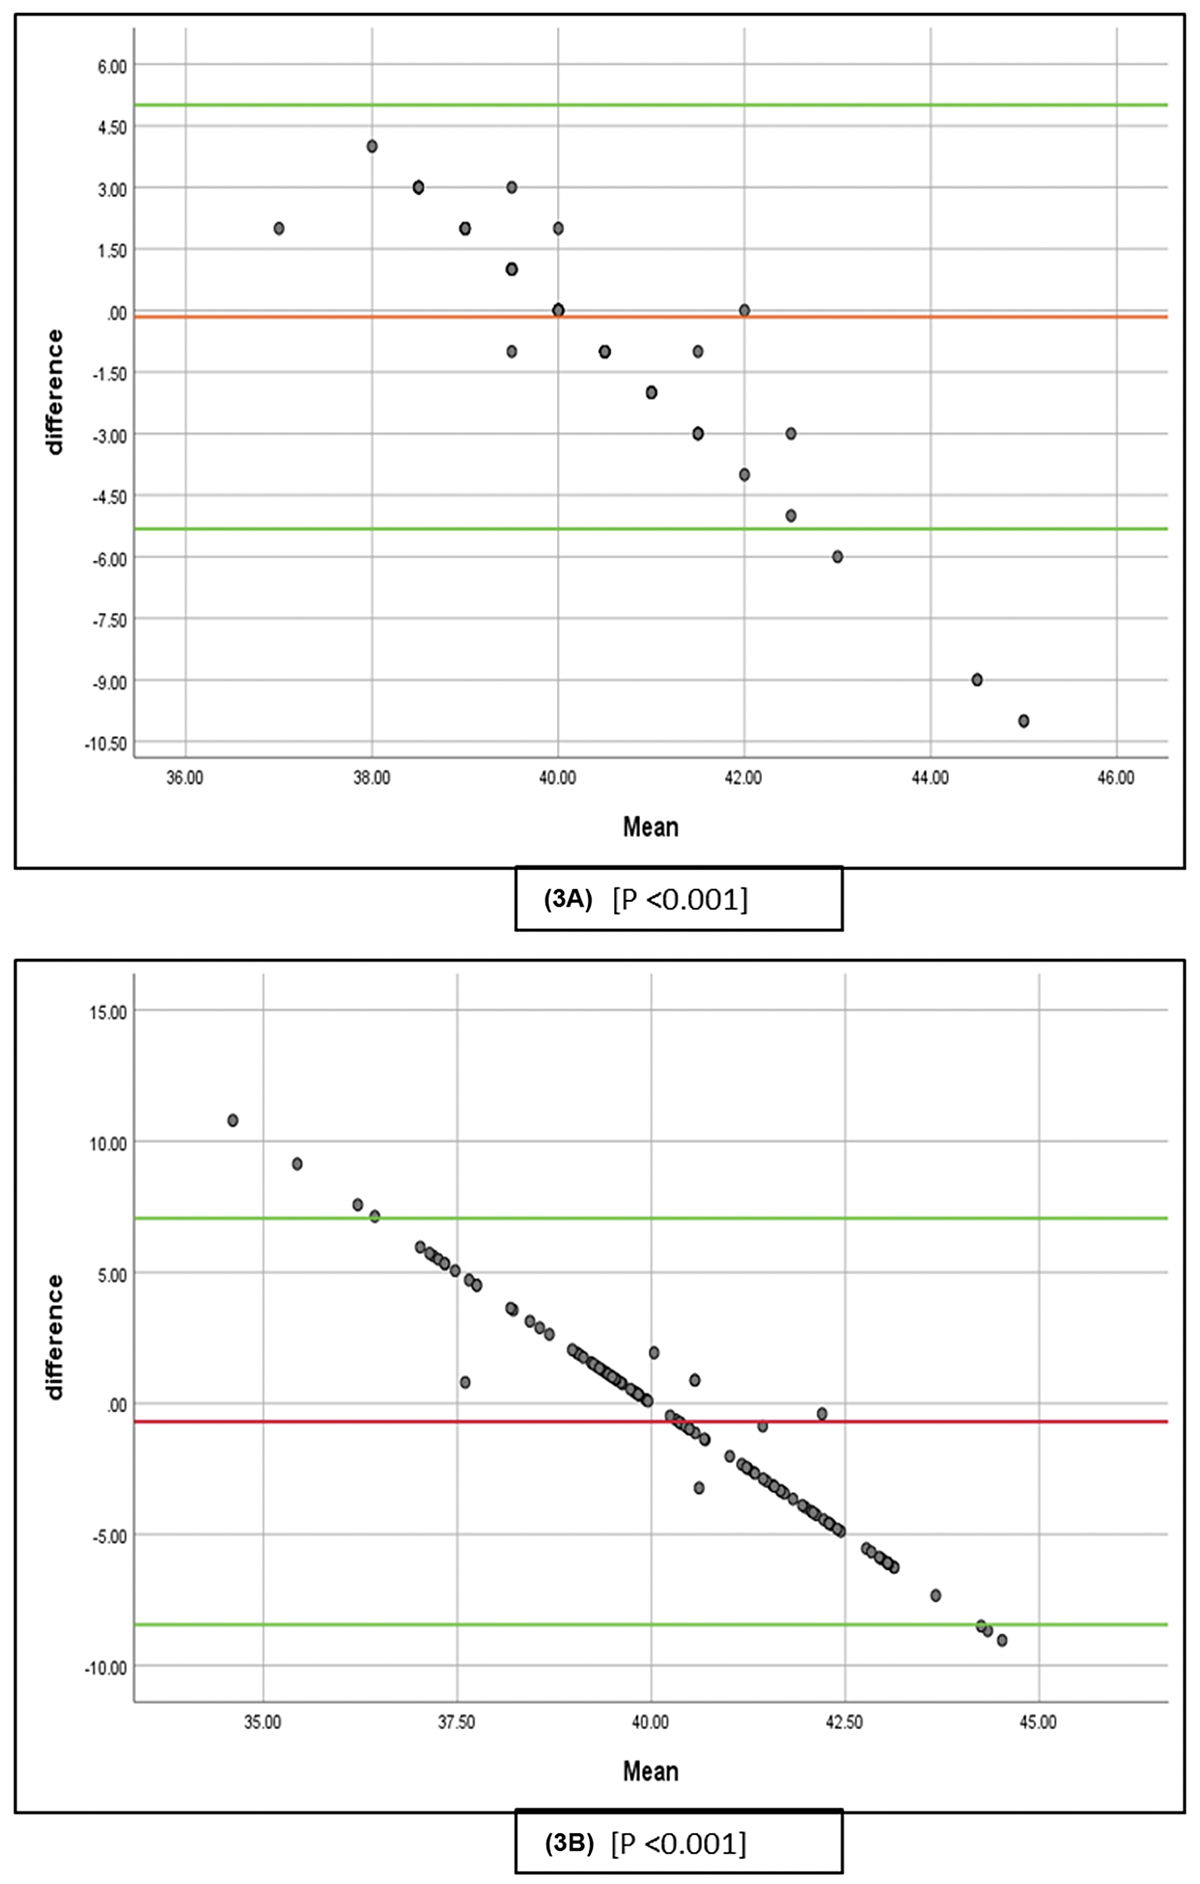
(A) The modified Bland-Altman figure, which includes the 95% prediction interval of the mean, shows the discrepancy between the intraoperatively recorded cup inclination and the preoperative plan. (B) The adjusted Bland-Altman plot shows the 95% confidence interval for the mean and the discrepancy between the postoperatively measured cup inclination and the preoperative plan.
Current usage metrics show cumulative count of Article Views (full-text article views including HTML views, PDF and ePub downloads, according to the available data) and Abstracts Views on Vision4Press platform.
Data correspond to usage on the plateform after 2015. The current usage metrics is available 48-96 hours after online publication and is updated daily on week days.
Initial download of the metrics may take a while.