Figure 3
Download original image
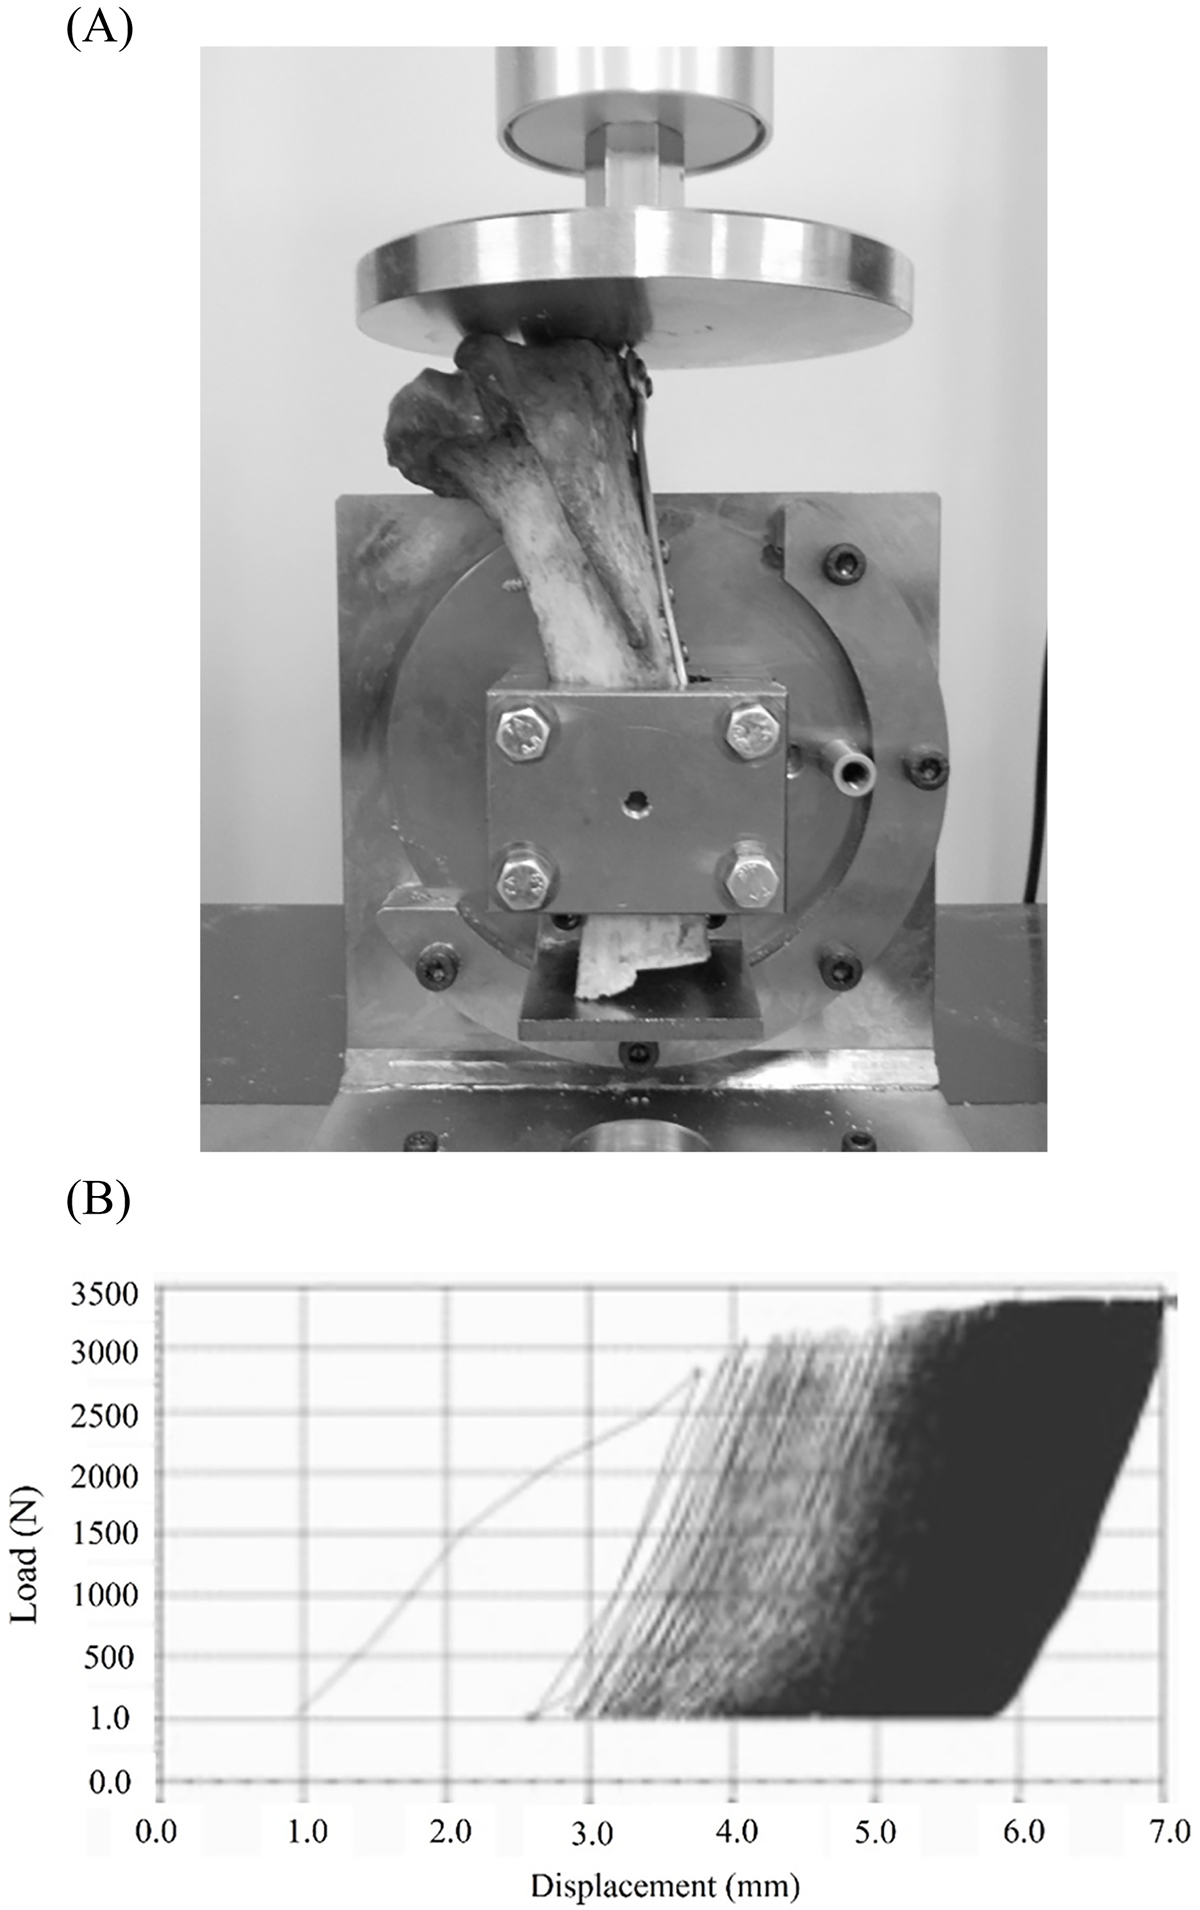
Tensile testing setup and load–displacement curve during cyclic testing. (A) Photograph of the tibia mounted in the tensile testing machine after internal fixation with a locking plate. (B) Schematic representation of the load–displacement curve generated by the software during cyclic loading. An axial load of 2800 N was applied to the tibial joint surface over 2000 cycles to evaluate biomechanical stability.
Current usage metrics show cumulative count of Article Views (full-text article views including HTML views, PDF and ePub downloads, according to the available data) and Abstracts Views on Vision4Press platform.
Data correspond to usage on the plateform after 2015. The current usage metrics is available 48-96 hours after online publication and is updated daily on week days.
Initial download of the metrics may take a while.