Figure 5
Download original image
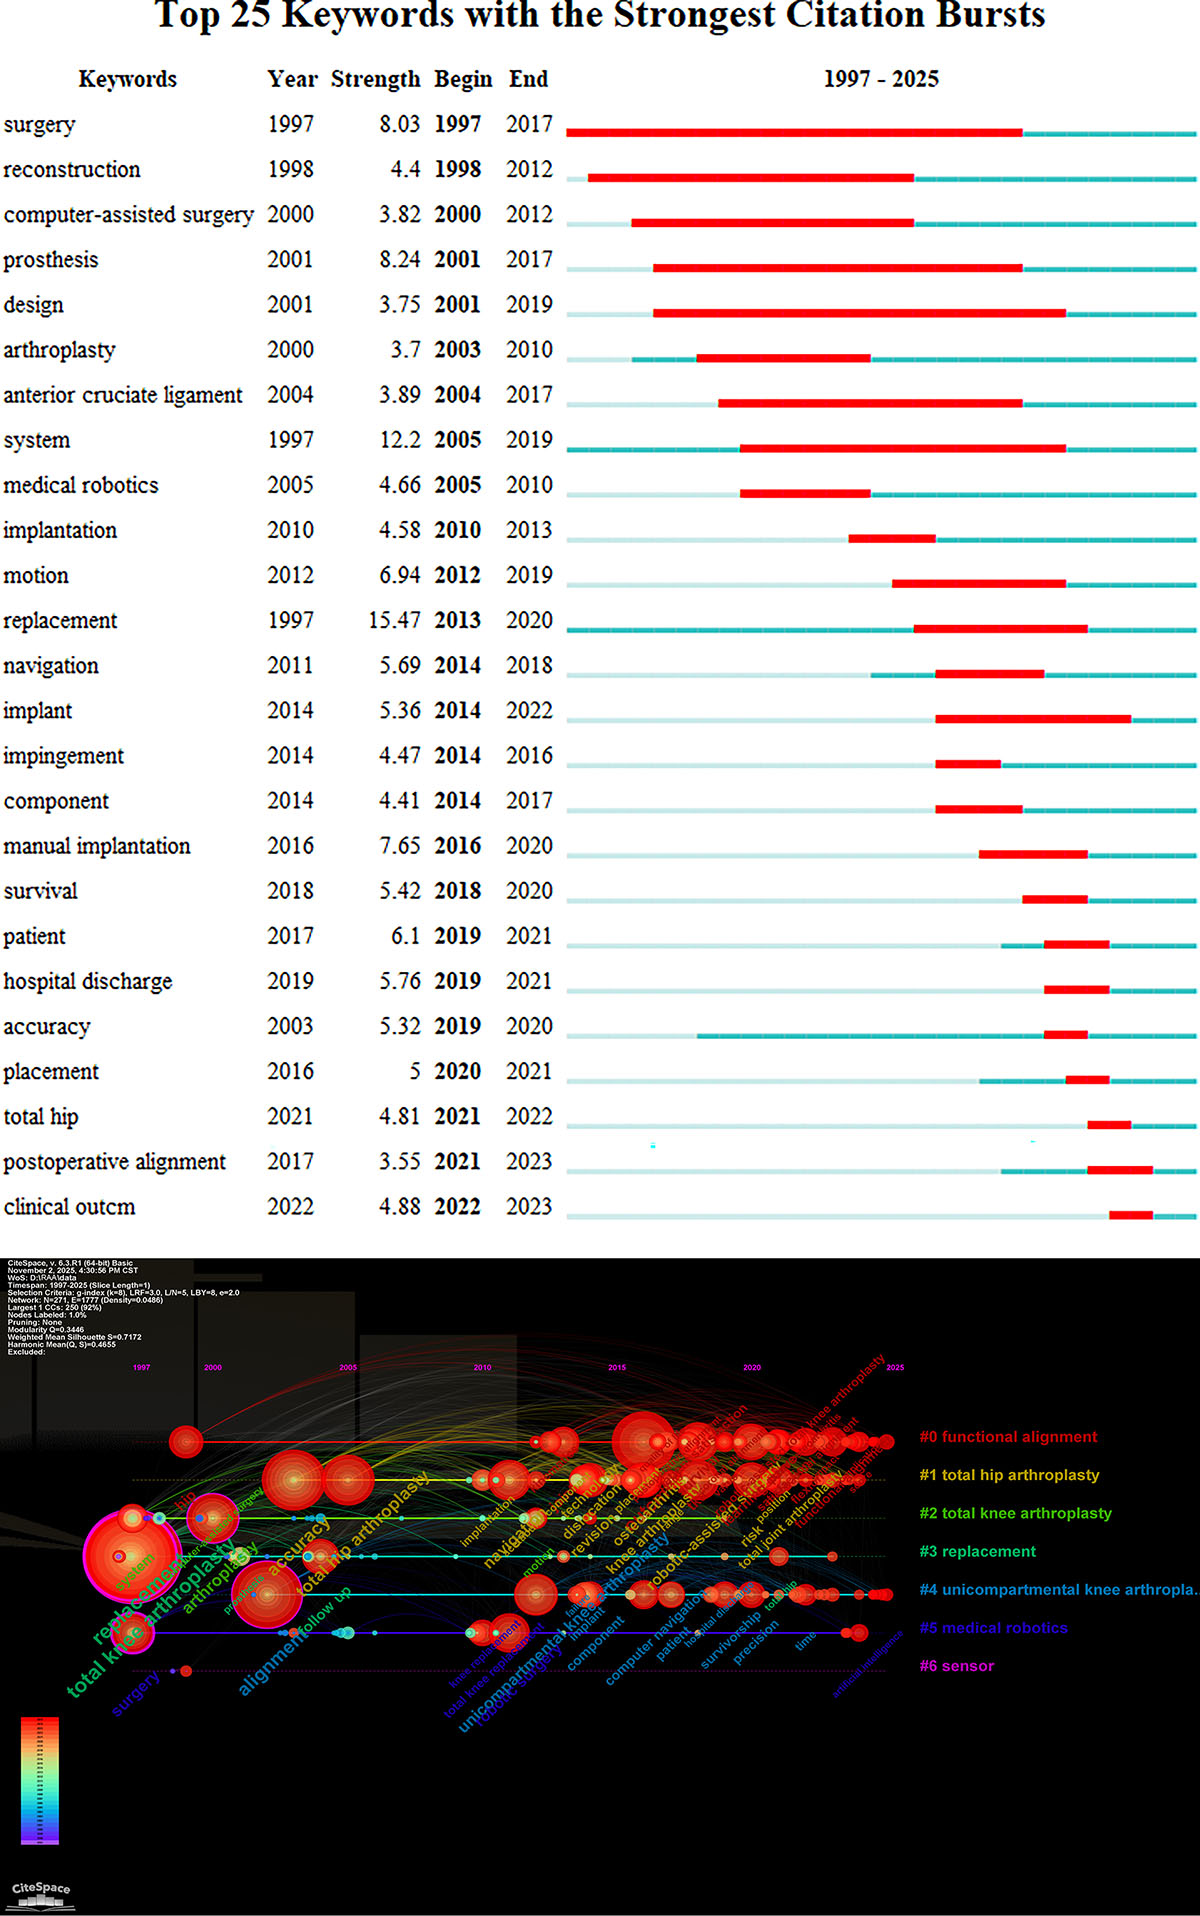
A: Top 25 keywords with the strongest citation bursts from 1997 to 2025. The red line indicates the duration of keyword bursts. B: Keyword evolution timeline from 1992 to 2025. Different colors indicated different clusters. Each circle represents a keyword, corresponding to its respective year in sequence and arranged chronologically. The curves between circles represent the correlation between keywords. Some cluster labels were refined in the text, such as #3 Clinical outcomes & implant performance and #5 Robotic system evolution.
Current usage metrics show cumulative count of Article Views (full-text article views including HTML views, PDF and ePub downloads, according to the available data) and Abstracts Views on Vision4Press platform.
Data correspond to usage on the plateform after 2015. The current usage metrics is available 48-96 hours after online publication and is updated daily on week days.
Initial download of the metrics may take a while.