Open Access
Figure 4
Download original image
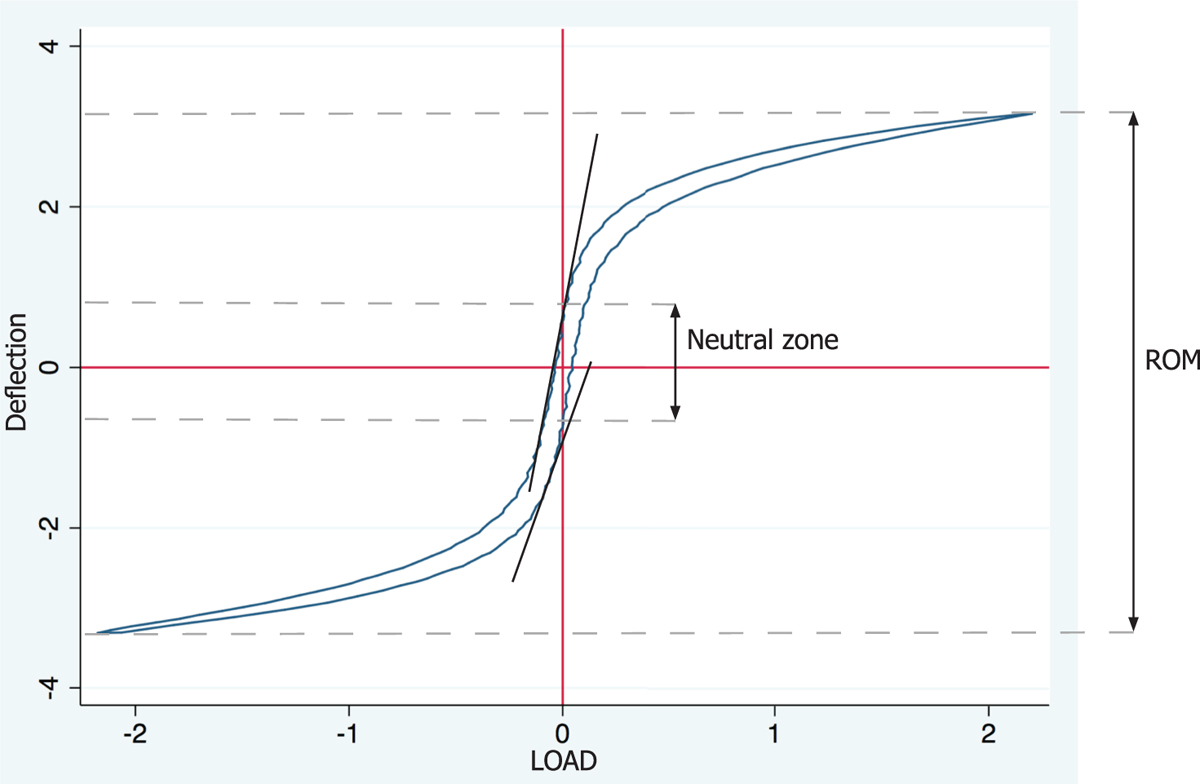
When load deflection data was plotted, two sigmoid curves were obtained, representing flextion and extension movement. Range of movement was measured as the maximum loading in each direction. Difference in intersection with the zero bar of load indicates the neutral zone. Neutral zone stiffness is the slope at zero load.
Current usage metrics show cumulative count of Article Views (full-text article views including HTML views, PDF and ePub downloads, according to the available data) and Abstracts Views on Vision4Press platform.
Data correspond to usage on the plateform after 2015. The current usage metrics is available 48-96 hours after online publication and is updated daily on week days.
Initial download of the metrics may take a while.